

Gartner Magic Quadrant
A way to compare products or services using two dimensions
The Gartner Magic Quadrant is a framework for comparing providers or products in a particular market. It places them on a two-axis chart using Ability to Execute and Completeness of Vision.
The result is divided into four quadrants:
Leaders — strong execution and a strong vision for the market
Challengers — strong execution, with a less complete vision
Visionaries — a strong vision, with less proven execution
Niche Players — more limited execution and/or vision within the market being examined
AI can help you identify the criteria, organize available information, and compare products or providers. The placement still depends on the evidence, definitions, and judgments used in the analysis.
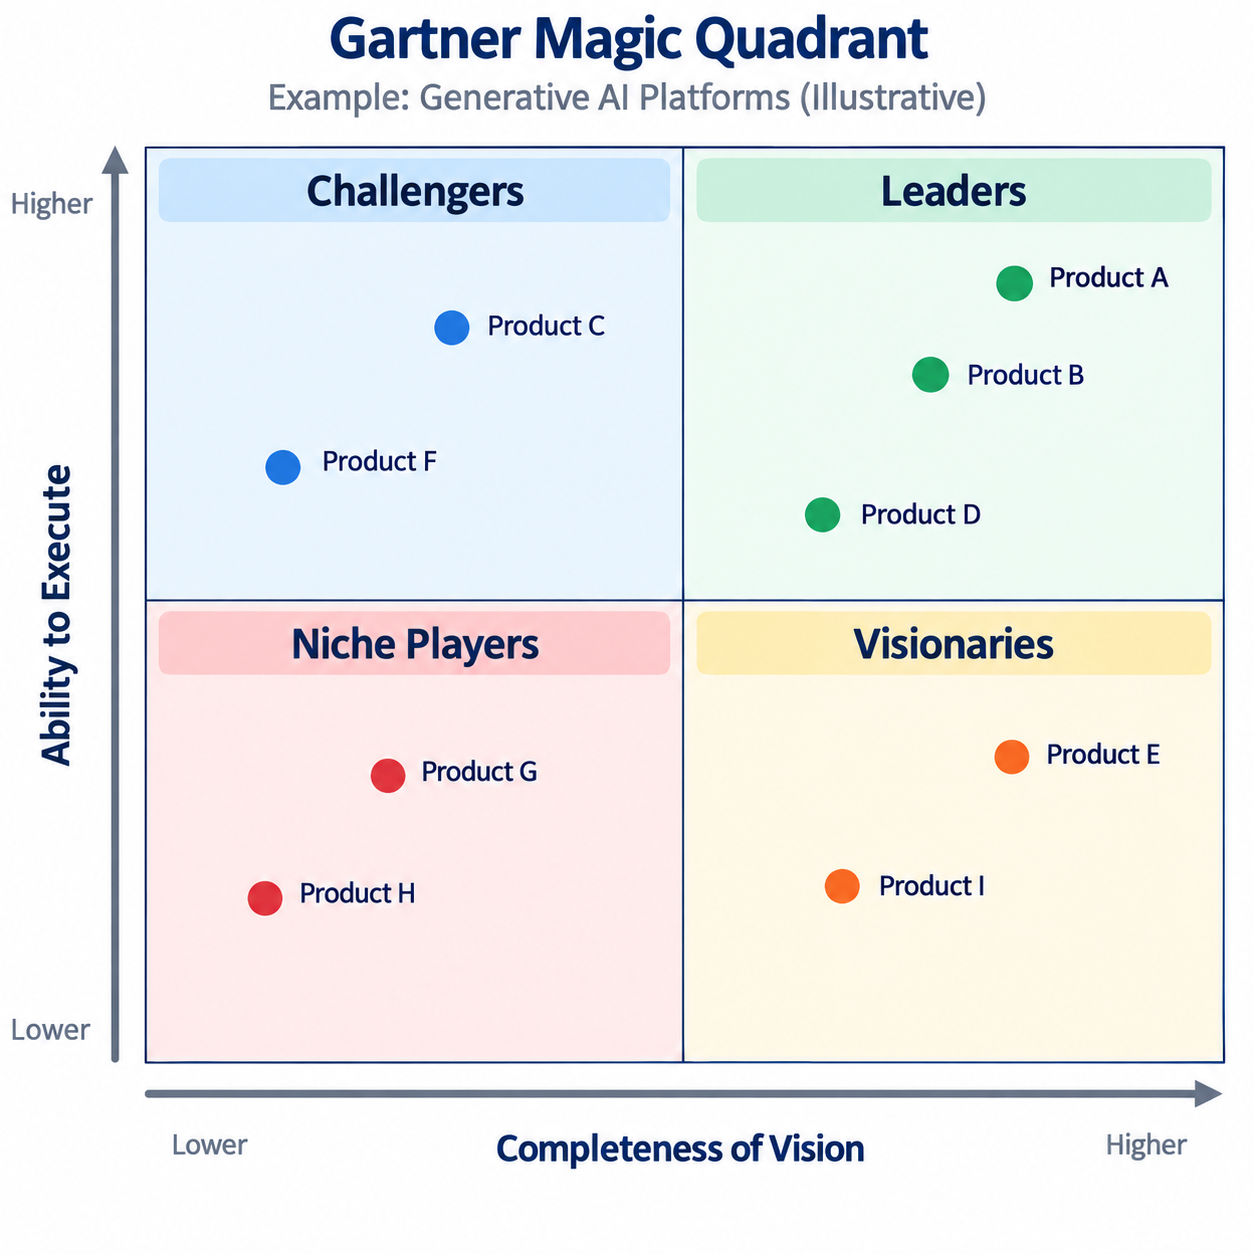
Figure: An illustrative Gartner-style Magic Quadrant. The products and positions shown are fictional.
When to use it
Use a Magic Quadrant-style analysis when:
you want to compare several products or providers
two major dimensions are especially important to the decision
you want to see how different choices compare on the same criteria
you are evaluating competing technologies or services
you want to distinguish established performers from newer or more specialized alternatives
What the quadrants mean
Leaders
Leaders score relatively well on both execution and vision. They may have strong products, established customers, significant resources, and a clear direction for the market.
Challengers
Challengers demonstrate strong execution but may have a less complete vision of where the market is going. They can be strong choices when current performance matters more than future direction.
Visionaries
Visionaries have ideas, capabilities, or a market direction that may be distinctive, but their ability to execute may be less established.
Niche Players
Niche Players may serve a particular segment, use case, or geographic market especially well. Their position does not necessarily mean they are poor choices. A specialized product may be a very good fit for a particular need.
Try this with AI
Create a Magic Quadrant-style analysis of [products, services, or providers]. Define two useful evaluation dimensions before placing anything on the chart. Explain the criteria for each dimension, identify the evidence supporting each assessment, and place each option in the appropriate quadrant. Distinguish facts from judgments and identify information that should be verified.
Then ask a follow-up
Which placements are most uncertain? What evidence has the greatest effect on each position? Show me how the chart would change if the criteria or their weighting changed.
You can then ask AI to examine one product or provider in greater detail rather than accepting the chart as a final ranking.
A useful caution
A Magic Quadrant-style chart can make subjective judgments look precise.
The axes, criteria, measurements, and placement decisions all affect the result. Two analyses can produce different charts from the same group of products if they use different criteria or assign different importance to those criteria.
An AI-generated chart can add another layer of uncertainty. AI may assign positions without reliable evidence or may treat marketing claims as established facts.
Ask AI to explain the evidence behind each placement. For important decisions, check the underlying information yourself.
A product in the Leaders quadrant is not automatically the best choice for you. A Niche Player may be a better fit for a particular need.
Remember
A Magic Quadrant-style analysis gives you a structured way to compare choices. The chart reflects the criteria and evidence you use; it does not make the judgment for you.